
Investigations can be extremely stressful, especially if they involve the analysis of a large volume of data. You need the right analytics tools to examine the possible patterns of fraudulent occurrences if they exist in any large data set. The use of data analytics is a powerful fraud prevention, detection, and investigation tool, and an important part of an effective and holistic fraud risk management program.
Benford Law comes in handy for fraud investigations. Despite its complexity to grasp at first, it provides an extra method for fraud examiners to test data for potentially fraudulent activity. Here’s more on what it is exactly and how fraud examiners can use it, and the underlying assumptions.
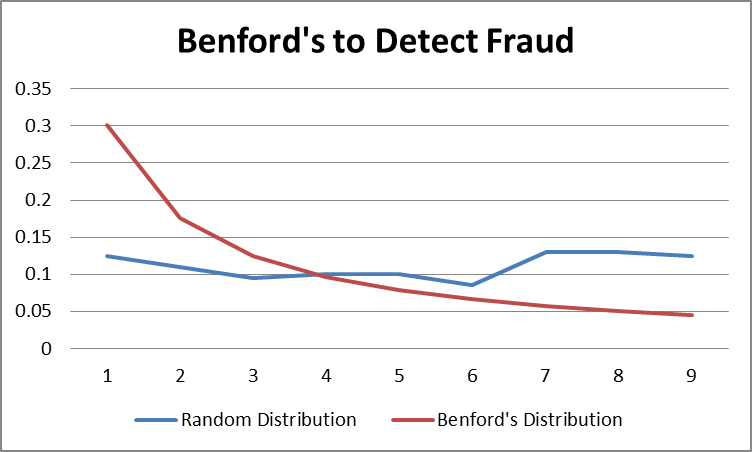
- The Law relies on the idea that the distribution of digits in multi-digit natural numbers is not random. Instead, it follows a predictable pattern.
- It applies only to “natural numbers.” Natural numbers in a fraud investigation are those numbers that are not ordered in a particular numbering scheme and are not human-generated or generated from a random number system. Non-natural numbers are designed systematically to convey information that restricts the natural nature of the number (e.g., postal codes and telephone numbers).

Fraud examiners use Benford’s Law tests on natural numbers, like payment amounts. The theory is that if a fraudster submits fraudulent invoices for payment, he won’t submit invoices for $100 or $200; he will want to go big and submit invoices for $900 or $800. If this is repeated severally times, it upsets the natural order of the way numbers should occur (according to Benford). For example, if you run a Benford’s Law test on your January–June payments 2023, and you find the first digit was 9 in 35% of the costs, that’s an anomaly. Bendford’s Law says 9 should be the first digit only 4.6% of the time.
Below is a worked-out example of Benford analysis. Please note that Benford’s Law applies to large datasets of at least 150,000 records and above.
We have prepared a data set of 189,471 invoice payments. The challenge is to determine anomalies if any anomalies in the given data set. These are invoices submitted for payment. Any amount above USD55,000 must be supported by an LPO. We must analyse the data to determine if it follows the Benford principle of natural number distribution.

“The use of data analytics is a powerful fraud prevention, detection and investigation tool”
Below are the steps.
- Download the summitBI Benford Law Template here.
- In Tab 3 (Source Data), extract the first two digits from the left using the LEFT trim data analytics function. However, since they are negative invoice amounts in the data set, add the ABS function to make them positive — =LEFT(ABS(D2),2)
- In Tab 1 (Tables), complete the First Two Digit Test by populating the fields in the table.
- Use a sequence data analytics function, make the first two-digit numbers from 10-99 — =SEQUENCE (90,1,10,1). The sequence function returns a sequence of numbers based on the number of rows, columns, starting number, and step size.
- Using the COUNTIF data analytics function, count the number of times the first two-digit numbers appear in the data source. Use the column First Two in Tab 3 — =COUNTIF(‘3. Source Data’!$E$2:$E$189471,”=”&’1. Tables ‘!H6)
- Compute the actual by dividing the first two digits by the sum of the count of the first two digits — =I6/$C$5
- Compute the Benford Law PD using — =LOG(1+1/H6)
- Calibrate the difference between actual and Benford — =J6-K6
- Determine the absolute difference using the ABS function to eliminate negatives on the difference between actual and Benford — =ABS(L6)
- Compute the Z-statistics. It measures how far the observed proportion of a digit is from its expected Benford proportion, in units of standard deviations — =(J6-K6)/SQRT(K6*(1-K6)/$C$5)
- Visualize the data using columns of count, actual, and Benford. The outliers will automatically show up.
What are your outliers?
To receive the complete worked model, send an email to support[at]summitcl.com or WhatsApp +775845691
For a customized data analytics training or to attend our weekend data analytics training, register here: https://www.summitcl.com/data-analytics-registration-form/