Figure 1: CERUDEB’s jaws ratio year-on-year
If you follow the developments in the banking sector, you could have noticed published financial reports by banks as 1st May 2020 approached. At Summit Consulting Ltd’s summitBI, we collect and publish the annual banking sector report. Based on our analysis, 2019 was a year of mixed fortunate for banks, see Figure 2. Seven banks made losses, two more compared to 2018. Keep in mind there was no coronavirus in financial 2019.
Based on the published financial statements, the industry average cost to income ratio was 81.4%. That means for every Ugx. 100 made by the bank, 81.4 was spent in acquiring it.

Figure 1: Uganda’s banking sector highlights
The focus of any bank is on how to increase the return on equity. How to increase revenue with operational excellency? How to reduce the costs of operations to reduce the overall cost to income ratio which makes our banking business model sustainable?
In 2017, Stanchart bank started implementing a new digital strategy. You recall how they closed many of the branches and established digital touchpoints. Today, they continue implementing the same strategy. And it is started showing results. The same was done by Stanbic. To see detailed insights into the impact of the digital agenda on these banks, visit www.summitcl.com, and download the full report.
The Cerudeb’s jaw’s ratio
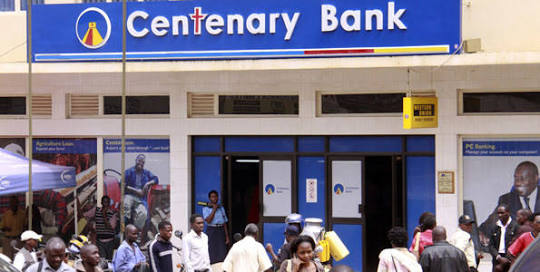
Centenary Rural Development Bank (CERUDEB) is one of the banks that is has managed to contain costs and widened the gap of the jaws since 2017. Study figure one carefully. One of the measures of bank profitability is the ability to grow revenue at a higher rate than costs also known as positive jaws ratio.
When the rate of revenue growth is par with that of cost growth, it points to inefficiency and a tough business model. Bank leaders or any business leader must invest in analytics and business intelligence to examine the cause of the high-cost structure to address the challenge early. The bank that keeps the growth of costs lower compared to the rate of growth of revenue wins.
In Figure 1, at Cerudeb, the rate of growth of costs was at par with revenues in 2017. In 2018, costs grew faster, as the costs line is seen to move higher, while the revenue line dropped. However, in 2019, the trend started reversing.
There is a need for more cost control at Cerudeb through business process analysis, delivering convenient banking by making banking as part of the customer journeys, and solving the challenges of her customers – wealth management and retirement planning.
It does not matter how much money you make, if all goes away in operating costs, the shareholders will not have enough. Return on capital will suffer. And investment in the ecosystem digital agenda won’t be possible.
Carefully study Figure 1: what do you recommend Cerudeb should do to keep the lower line further down?
Copyright Mustapha B Mugisa, 2020. All rights reserved.


